


– Sudesh Zingde (3TP 2016)
Today’s Business World is ever changing at amazingly high speed & Liberalization has literally converted the world into a “Global village”. The fierce global competition and growing customer demands have compelled business organizations to constantly explore all possible ways to optimize the resources , reduce the costs and consistently deliver good quality of products and services at right TIME and right location as needed by the customer or for end use. It is, therefore, crucial for organizations today to go for continuous improvement and offer innovative products & services to delight their Customers.
To manage growing & complex business, the 21st century managers need to constantly drive their business towards set Business Goals, use historic data as a “rear-view mirror” and keep a close watch on the competitors as “side mirrors” to judge how and where the industry is moving. To remain competitive and meet customer demands, organizations continuously need reliable and relevant INFORMATION at right time to right decision makers to enable them to take Effective and timely Decisions to achieve organizational GOALS through prompt actions.
The task of transforming huge unstructured DATA into Actionable Information is made possible and easy with Business Intelligence (BI). The BI includes set of software tools and techniques for data warehousing, Statistical Analysis, Predictive Analytics, Interactive Reporting and Visualization. It can use large amount of data from various sources, analyze the data with complex algorithms and present the Information in the form of graphical displays and reports (called dashboards). These dashboards provide far better information “At a glance”, compared to old style ‘simple reports’. Effective use of BI can greatly help professionals to make improved decisions for day-to-day operations, tactical and strategic planning. BI has indeed become one of the key pillars of new age information ecosystem and can help organizations to enhance their competitive advantage and move from GOOD to GREAT!
According to some market reports (Source : Stratistics MRC & Gartner), the Global BI & Analytics market is expected to grow from approx. $15 billion in 2016 to around $30 billion by 2023 and would generate a huge number of new and exciting opportunities.
Recently, I was invited as a guest speaker at one of the “Data Analytics & BI” seminar. After initial presentation by some IT professionals, I realized that the participating senior managers from manufacturing industry perceived BI as a tool that would make them “IT dependent”. Many also thought that BI can only help large organizations and not meant for smaller organizations, while some strongly felt that such technologies can affect the jobs. To eliminate their resistance to such a wonderful technology implementation, I shared my practical experiences and some success stories on implementation of BI during last 10 years with vast range of applications in various business areas.
Many of these could be useful to several business organizations to enhance the organizational performance. Here are some useful ideas that could help!
Demand planners in healthcare & related organizations can use geographic statistics, population statistics, birth & mortality rates, number of registered hospitals & healthcare statistics data made available by various Authorities. In the below BI dashboard, we can get the graphical statistics of number of hospitals in India and at the same time along-with the GDP information by states. The slicers allow selection of Private / Public hospitals and clicking on a state would allow user to drills down to the district levels. The size of the circles on the map is proportionate to the value (number of hospitals or GDP or population). There is a vast amount of visualization options that can be used for a quick decision making directly by the functional managers with minimal help from IT.
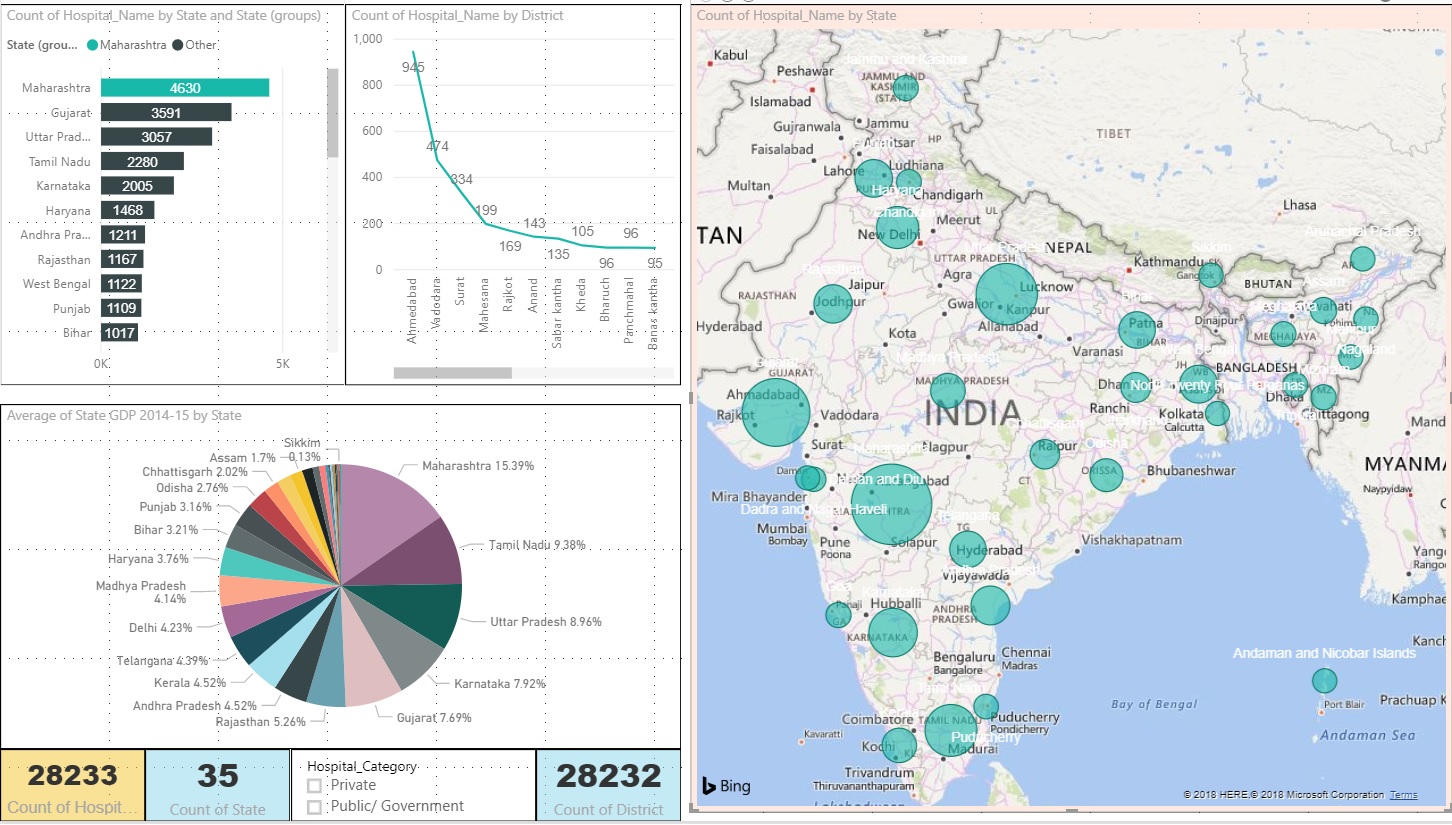
Note : The data used for the dashboard graphics is from public domain for reference purposes only.
Using the BI tools, the complex corporate level data can be professionally presented for various corporate reporting needs like business Performance Management & Balanced Scorecards.
- Use the Quotations, Sales, purchase and dispatch data to get a 360-degree view of Customer activity in real time by intelligent use of Funnel charts & drill down visuals. Analyzing customer behaviors, buying patterns and sales trends can help to improve accuracy of forecasts. This can greatly help to maintain optimum inventory levels and also offer intelligent solutions to the customers. BI can be used for predicting financial & sales performance .
- The purchase dashboards can quickly provide history , price trend analysis , quality deviations , on time arrival statistics , etc and managers can use this feedback for further negotiations
- The shipment dashboards can help in optimizing the freight costs, improving the global supply chain effectiveness and can provide a quick status overviews of current projects.
- The GS1 barcodes introduced for the pharmaceutical industry in India can be used for wide range of data analysis, tracking and automation in materials handling in pharma supply chains.
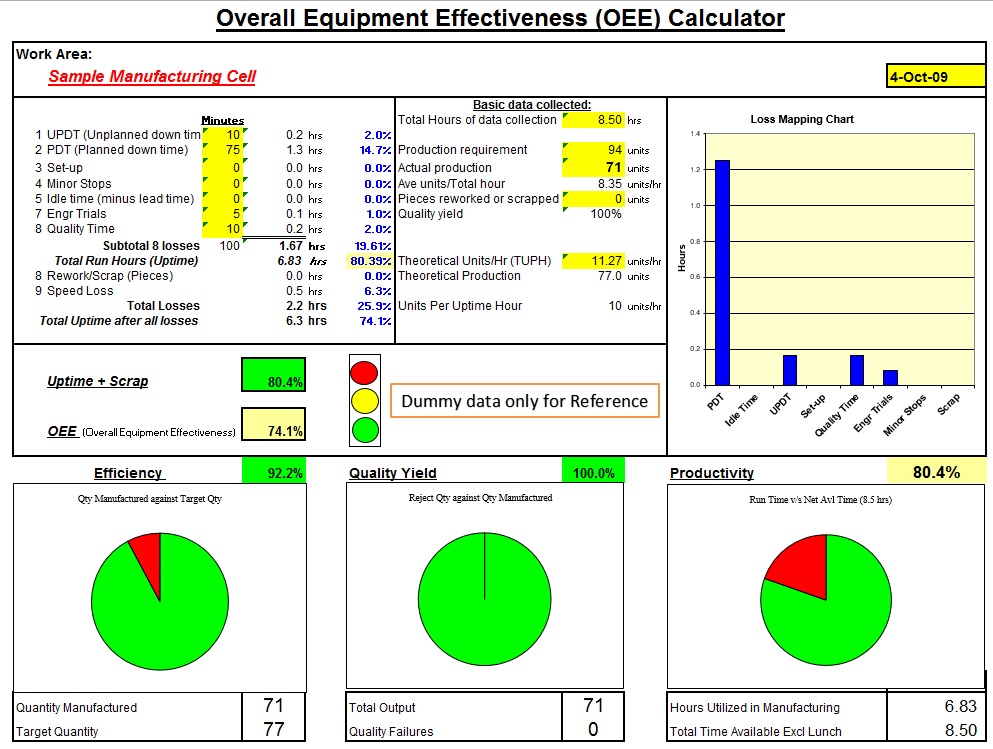
Business Intelligence tools can help Manufacturing & Operations managers in their various tasks like optimizing processes and operational performance using concepts like OEE (Overall Equipment Efficiency) where the Quality Yield , Efficiency and Productivity are measured for key manufacturing cells to give a consolidated overview, clearly highlighting the scope of minimizing the un-planned downtime , quality rejections and other useful information.
- SPC (Statistical process Control) can help quality inspectors to get a visual chart of products or measurements falling out of the Set Control limits , thereby allowing online inspections without disturbing the manufacturing setup.
- Online weighing, temperature-monitoring dashboards can help warehouse managers as well as quality control personnel to take quick decisions.
- Data from various digital instruments, barcode scanners & online sensing devices can be transformed for LEAN and efficiency enhancements.
- In large manufacturing organizations, the BOM (Bill of materials) based costing, materials planning is huge, and BI can greatly help to focus on the issues / right areas.
- Some large-scale manufacturing use Linear & 2D Optimization software to minimize the scrap generated, while cutting of material. BI can transform such massive data of planned v/s actual consumption and display the results in a presentable graphics.
- Visual warehouse utilization dashboards can use ERP to provide fantastic overviews of current and future resource utilization & improve operational efficiency.
- Inventory tracking with the use of RFID & barcoding can help multi-location warehousing that have strict norms for storage and follow GDP (Good distribution practices).
One Gentleman from Agro Industry was curious to know how technology can help agriculture and I shared my experience when I visited my colleague’s farmhouse in Nebraska USA 10 years back. I was myself pleasantly surprised to see the brilliant use of technology in large-scale farming in a “practical way by a Corporate person”. This highly educated, senior management professional has intelligently used a vast amount of data collected by using precision irrigation system (Innovative product of the company we worked for) combined with weather forecasts to maximize the crop yield. These systems allow connecting multiple farms situated at multiple geographic locations using GPS and can provide real-time dashboards that help the decision maker to start/stop machines based on defined parameters or user selection on GPS devices.
Large-scale farming with scientific methods and right technology can immensely help India to Excel in much-needed profitable growth in the Agricultural sector and food Industry. It can employ millions and generate new business opportunities to setup large supply chains & provide fresh food to crores of Indians. It could transform farming from a “low profile job” to an Industry standard & save scarce water resources by growing “more crop per drop”. Large-scale farming would reduce the cost of local production & can greatly help to minimize imports of food and have self-reliance in food production.
As some participating managers feared that such technology could affect employment, I also emphasized that such technology can also “create jobs”. One of the European guest was quite impressed with the knowledge sharing and during the informal talks over dinner, humorously asked me if we have “GODS of employment” in India and I quickly reverted “yes – we do have”:
- Generating Industries ( Agriculture , food and other manufacturing Industries)
- Operations ( supply chain , sales & distribution )
- Data management Organizations
- Service Industries
Put together, aren’t these like the “GODS of jobs”? As I reached home, coincidently I heard one of the TV debate participant complaining “but, Where are the jobs?” and I asked myself – is it not the TIME to energize these GODS and create millions of new jobs in India?
I had to rush for a travel next day to celebrate TEAM accomplishments, so I went to sleep with a “Dream of Clean & Green India” and a positive assurance to myself… “Yes WE can!” – I sincerely hope that our National leaders and policy makers would help the Nation by considering the next level of “Green Revolution” and energizing the “GODS of Jobs” and take this GREAT country to new heights!
Sorry, the comment form is closed at this time.